Third-party Verification
NS United Kaiun Group acquired third-party verification of its GHG emissions calculated in accordance with ISO14064-1*1 and obtained a verification statement.
-
 Third-Party Verification Statement 2024
(1,059KB)
Third-Party Verification Statement 2024
(1,059KB)
|
(Scope) All offices and vessels operated by NS United Kaiun Group |
2020 |
2021 |
2022 |
2023 |
2024 |
|
Scope 1 (Direct emission from our activities) |
2,328,090.09 |
2,446,845.39 |
2,423,531.92 |
2,342,423.02 |
2,469,009.65 |
|
Scope 2 (Indirect emission from the use of purchased electricity, heat, and steam) |
239.73 |
235.21 *2 |
128.33 |
139.72 |
129.80 |
|
Scope 3 (Other emission) |
324,088.60 |
336,596.91 |
336,617.43 |
372,574.40 |
351,374.81 |
|
Category 1 (purchased products and services) |
- |
- |
2,141.96 |
6,496.52 |
9,447.46 |
|
Category 2 (capital goods) |
- |
- |
- |
37,291.01 |
4,220.93 |
|
Category 3 (upstream fuel & power) |
323,943.94 |
336,312.07 |
333,742.64 |
327,540.79 |
336,356.60 |
|
Category 5 *3 (waste) |
- |
92.36 |
63.38 |
69.72 |
76.35 |
|
Category 6 (business trip) |
- |
- |
475.96 |
992.85 |
1,084.07 |
|
Category 7 (commuting) |
144.66 |
192.48 |
193.49 |
183.52 |
189.40 |
|
Total GHG emissions |
2,652,418.42 |
2,783,677.51 |
2,760,277.68 |
2,715,137.14 |
2,820,514.26 |
(tCO2e)
*1:Specification with guidance at the organization level for quantification and reporting of greenhouse gas emissions and removals
*2:Renewable energy has been used for electricity at head quarters since November 2021.
*3:Please refer to the scope of the "Waste" below.
■ Scope 1 ■ Scope 2 ■ Scope 3
(thousand tons)
|
(Scope) All vessels operated by NS United Kaiun Group |
2020 |
2021 |
2022 |
2023 |
2024 |
|
HFO (Non-consolidated) |
662 |
688 |
675 |
649 |
678 |
|
(consolidated) |
695 |
719 |
701 |
670 |
697 |
|
MDO (Non-consolidated) |
35 |
40 |
42 |
38 |
38 |
|
(consolidated) |
55 |
67 |
76 |
78 |
78 |
(thousand tons)
|
(Scope) All vessels operated by NS United Kaiun Group |
2019 (base year) |
2021 |
2022 |
2023 |
2024 |
|
(Non-consolidated) |
2,008 |
2,284 |
2,249 |
2,156 |
2,233 |
|
(consolidated) |
2,201 |
2,461 |
2,433 |
2,344 |
2,421 |
(thousand tons)
(g-CO2/ton.mile)
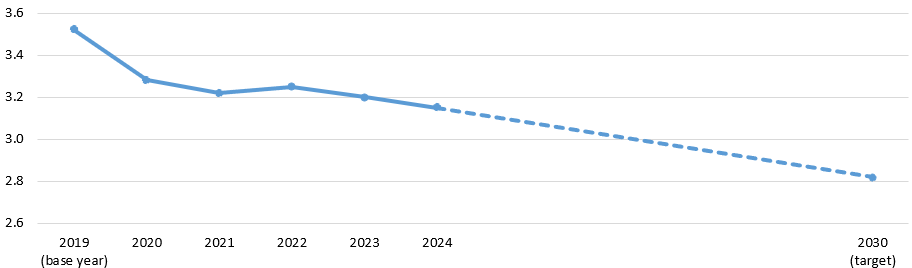
|
(Scope) All vessels operated by NS United Kaiun Group |
2020 |
2021 |
2022 |
2023 |
2024 |
|
SOx emissions (Non-consolidated) |
6.7 |
7.0 |
6.8 |
6.6 |
6.9 |
|
(consolidated) |
7.2 |
7.6 |
7.5 |
7.2 |
7.4 |
|
NOx emissions (Non-consolidated) |
49.2 |
50.4 |
49.4 |
47.0 |
48.8 |
|
(consolidated) |
- |
- |
52.3 |
49.8 |
51.6 |
(thousand tons)
|
(Scope) NS United Kaiun Kaisha, Ltd. and consolidated subsidiaries (ratio based onconsolidated sales:99%) |
2020 |
2021 |
2022 |
2023 |
2024 |
|
Electric power(kWh) |
297,206 |
309,134 |
299,657 |
261,066 |
233,624 |
|
Steam(MJ) |
201,348 |
447,760 |
489,146 |
395,870 |
467,076 |
|
Cold water(MJ) |
928,137 |
892,251 |
899,304 |
1,106,554 |
1,030,332 |
|
Wastewater* (ton) |
2,411 |
2,212 |
2,434 |
2,329 |
2,642 |
* Most water used on ships is generated from seawater and recycled.
|
(Scope) NS United Kaiun Kaisha, Ltd. and consolidated subsidiaries (ratio based on consolidated sales:99%*1) |
2020 |
2021 |
2022 |
2023 |
2024 |
|
Tokyo Office(ton) |
20 |
16 |
16 |
16 |
15 |
|
Material recycling (%) *2 |
67.4 |
61.6 |
62.6 |
55.6 |
51.5 |
|
Thermal recycling (%) *3 |
32.6 |
38.4 |
37.4 |
44.4 |
48.5 |
|
Vessel under our management(ton)*4 |
- |
1,048 |
632 |
712 |
812 |
*1 :Recycling method using waste materials as raw materials
*2 :Recycling method that recovers and uses waste incineration heat energy
*3 :Vessels operated by NS United Kaiun Kaisha, Ltd. (ratio based on consolidated transportation volume) 2022:35%, 2023:28%, 2024:30%
|
(Scope) All NS United Kaiun group consolidated sites |
2020 |
2021 |
2022 |
2023 |
2024 |
|
Number of cases |
0 |
0 |
0 |
0 |
0 |
|
Fine (yen) |
0 |
0 |
0 |
0 |
0 |
Our company has been committed to environmental conservation since acquiring ISO 14001 certification in 2003.
As of 2024, ISO14001-certified companies (i.e., our company) account for 88% of our total sales.
Please refer to the environmental management system page for the Implementation plan and results.